Here's another interesting Euretos Perspective article; this time on how knowledge graphs enable breaking down the barriers to integrate heterogeneous data. It discusses how in complex diseases, like Asthma, the variety of data that is used in disease research is very high and that combining and analyzing such heterogeneous data is best done in a knowledge graph. Enjoy the read and subscribe if you want to stay tuned!
Approximately 8% of the global population has asthma, so chances are that you, or someone you know, is living with asthma. Most of us know how challenging it can be to manage this chronic respiratory disease. Even with medication, many people continue to experience symptoms, and that's where biomarkers come in. These are measurable indicators of biological processes or disease activity in the body, and they can provide valuable information about asthma activity, severity, and response to therapy.
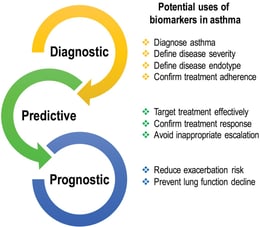 There are different types of biomarkers used in asthma, including inflammatory biomarkers that measure the level of inflammation in the airways, imaging biomarkers that use various imaging techniques to visualize the airways and lungs, and physiological biomarkers that measure lung function and airflow in the airways.
For example, imaging biomarkers like magnetic resonance imaging (MRI) can show the structure of the airways and computed tomography (CT) can show the extent of airway remodeling. Physiological biomarkers like peak expiratory flow rate (PEFR) and forced expiratory volume in one second (FEV1) can measure lung function and airflow in the airways.
By incorporating biomarker data into computational models of asthma, researchers can develop more accurate and personalized models of asthma, which can lead to better treatment strategies. These models can simulate the complex interactions between different disease processes, such as inflammation and airway remodeling, and help identify patients who may benefit from more aggressive therapy, like biologic agents.
A recent review article by Gil-Martinez et al. (January 2023) summarizes the roles of miRNAs in asthma and describe how they regulate the mechanisms of the disease. It further describes the current state of miRNAs as biomarkers for asthma phenotyping, endotyping, and treatment selection.
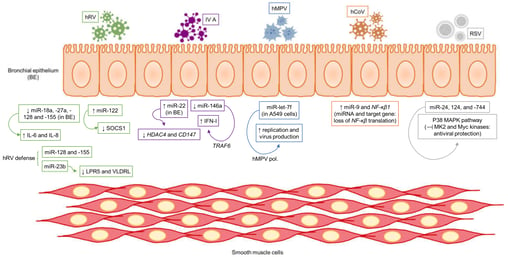 So, whether you're monitoring airway inflammation using FeNO or using MRI to visualize airway narrowing and remodeling, or measure presence of miRNA’s, biomarkers are an essential tool in the management of asthma. By measuring different aspects of disease activity, biomarkers can provide a more comprehensive picture of the underlying disease processes and support better treatment strategies.
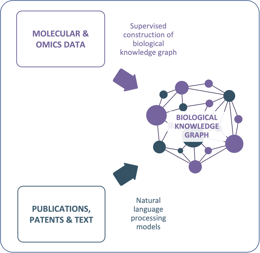
Asthma is a good example of the variety of data that is used in disease research and therapy. Combining and analyzing such heterogeneous data is best done in a knowledge graph. A knowledge graph is a type of graph database that uses a graph structure to represent knowledge in a machine-readable format. In a knowledge graph, data is represented as nodes and edges, where nodes represent entities (such as people, places, or things), and edges represent the relationships between those entities. Knowledge graphs can be used to integrate data from multiple sources, such as databases, text, and images, and to capture complex relationships and dependencies between different data points.
 One of the main advantages of knowledge graphs for analyzing heterogeneous data is their ability to handle semantic heterogeneity. Semantic heterogeneity refers to differences in the meaning of terms used to describe data, and it can be a significant barrier to data integration and analysis. Knowledge graphs can capture the meaning of data through their use of ontologies and taxonomies, which define the relationships between different entities and concepts in a domain-specific manner. This means that data can be integrated and analyzed more effectively, even when it comes from different sources and uses different terminology.
Furthermore, knowledge graphs can support advanced analytics, such as natural language processing and machine learning, by providing a framework for representing and reasoning about complex relationships between data points. For example, knowledge graphs can be used to identify patterns and trends in data, to generate recommendations based on data, or to predict outcomes based on data.
That is why Euretos creates biological knowledge graphs as the backbone of our computational disease models and target assessment workflows to enable data-driven target selection.
Author:
Aram Krol
CEO, Euretos
.svg)